You can't reward what you can't measure.
Every shop has a top tech and a struggling tech, but without numbers you can't have the conversation — and you can't build a bonus program that actually motivates.
- Bonuses paid on gut feel breed resentment
- Struggling techs get discovered only when they cost you a customer
- No fair basis for utilization or quota conversations
Live, per-tech scorecards.
Ratchly aggregates every completed job into a tech scorecard: revenue, jobs, average ticket, callback rate, and utilization. All live, all fair, all exportable.
Revenue per tech
Live totals for the week, month, and quarter.
Utilization %
Hours on paid jobs vs. hours on the clock — the metric bonuses run on.
Callback rate
The percentage of a tech's jobs that get a follow-up visit within 30 days.
Leaderboard view
Fair, transparent, and motivating for the team.
See it in the real product.
Every screenshot below is a live capture from a Ratchly account — not a mockup.
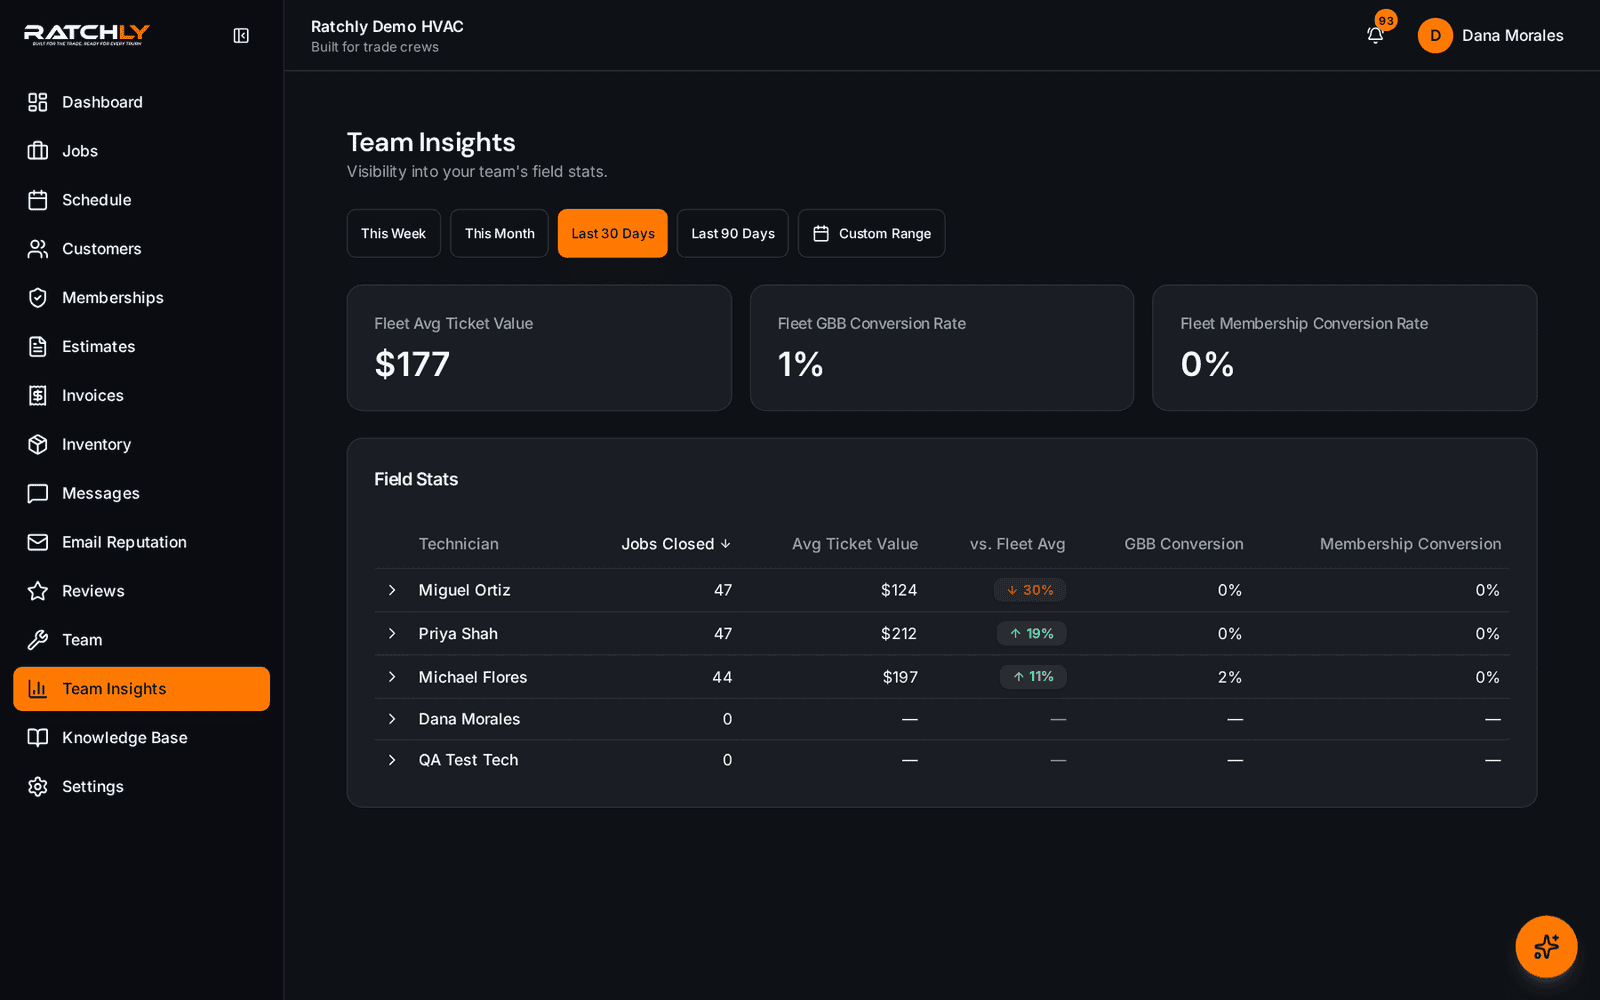
Team insights
Every tech ranked on the KPIs that matter most.
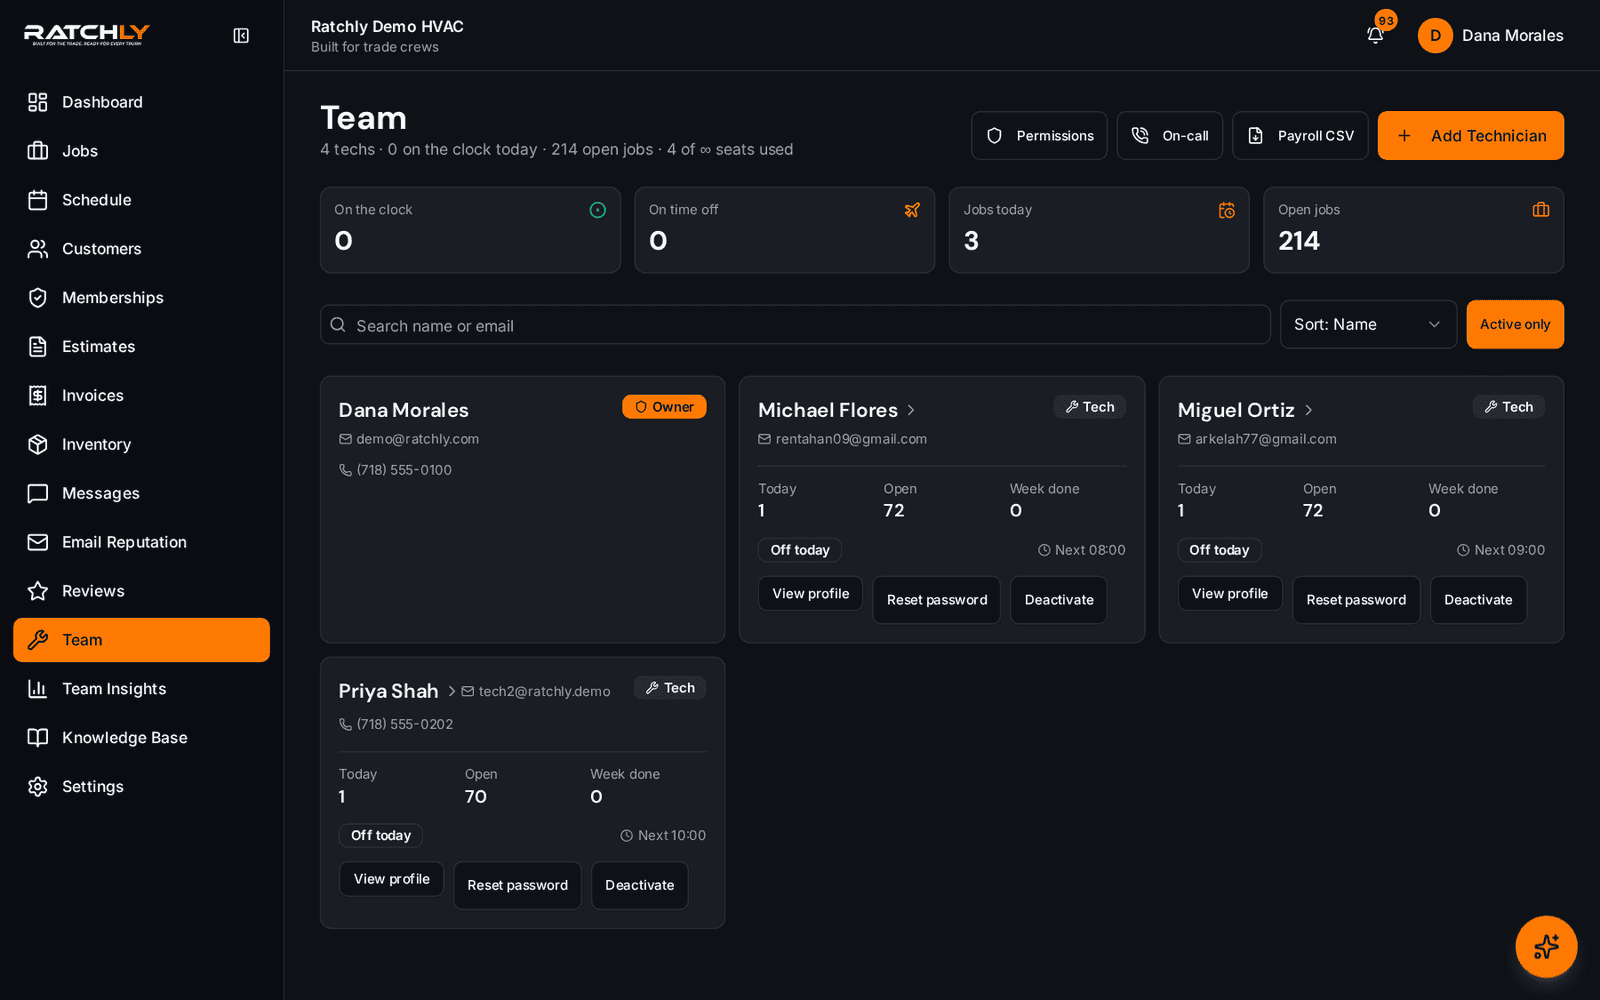
The team roster
Manage roles, permissions, and pay scales from the team page.
What it means for your shop.
- Fair, transparent bonus math
- Spot struggling techs before customers do
- Retain top performers by paying them for real production
Technician Performance — quick answers.
Do techs see each other's numbers?
You decide. Leaderboards can be team-visible or owner-only.
Can I export a payroll-ready CSV?
Yes. Export per-tech revenue by pay period for direct import into any payroll system.
Related features
Reports
Revenue by service line, jobs by tech, AR aging, customer lifetime value — no spreadsheets required.
Learn about ReportsBusiness InsightsDashboard
Money at risk, techs on the road, jobs today, month revenue — everything you need at 7am, before the first call.
Learn about DashboardBusiness InsightsRevenue Analytics
Ratchly slices revenue by service line, tech, customer segment, and time period so you can double down on what works.
Learn about Revenue Analytics