Revenue is a lump sum. Growth is a story.
Total revenue tells you whether the month was good. It doesn't tell you whether installs are up while maintenance is flat, or which segment of customers actually funds the business.
- You can't tell if a service line is growing or dying without spreadsheets
- Top 20% of customers hidden inside 100% of transactions
- Month-over-month trends buried in QuickBooks
Revenue with a story, not just a number.
Ratchly overlays revenue by service line, by tech, by customer tier, and by month — with trend lines that make growth (or drop-offs) visible in one glance.
Service-line breakdown
See install vs. maintenance vs. diagnostic revenue side by side.
Top customers
Rank customers by lifetime revenue — the top 20% that fund the business.
Month-over-month growth
Trend lines and % change on every chart.
Membership MRR
Track recurring revenue separately from one-off jobs.
See it in the real product.
Every screenshot below is a live capture from a Ratchly account — not a mockup.
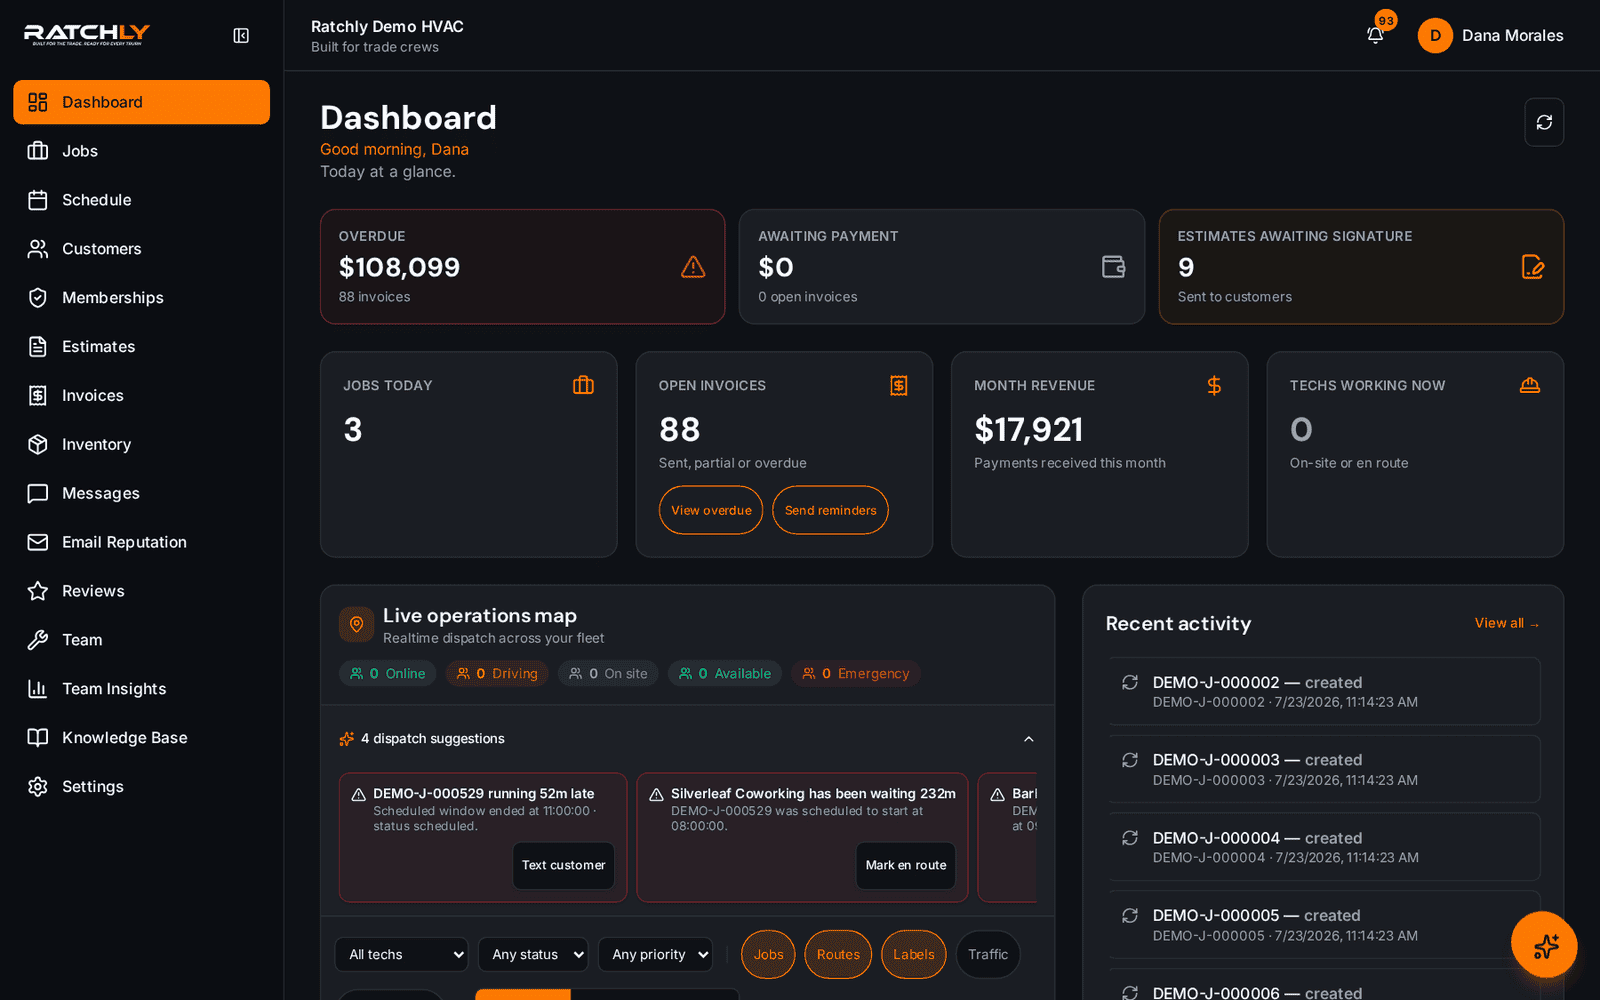
Dashboard-level revenue
Month revenue, awaiting payment, and overdue on one page.
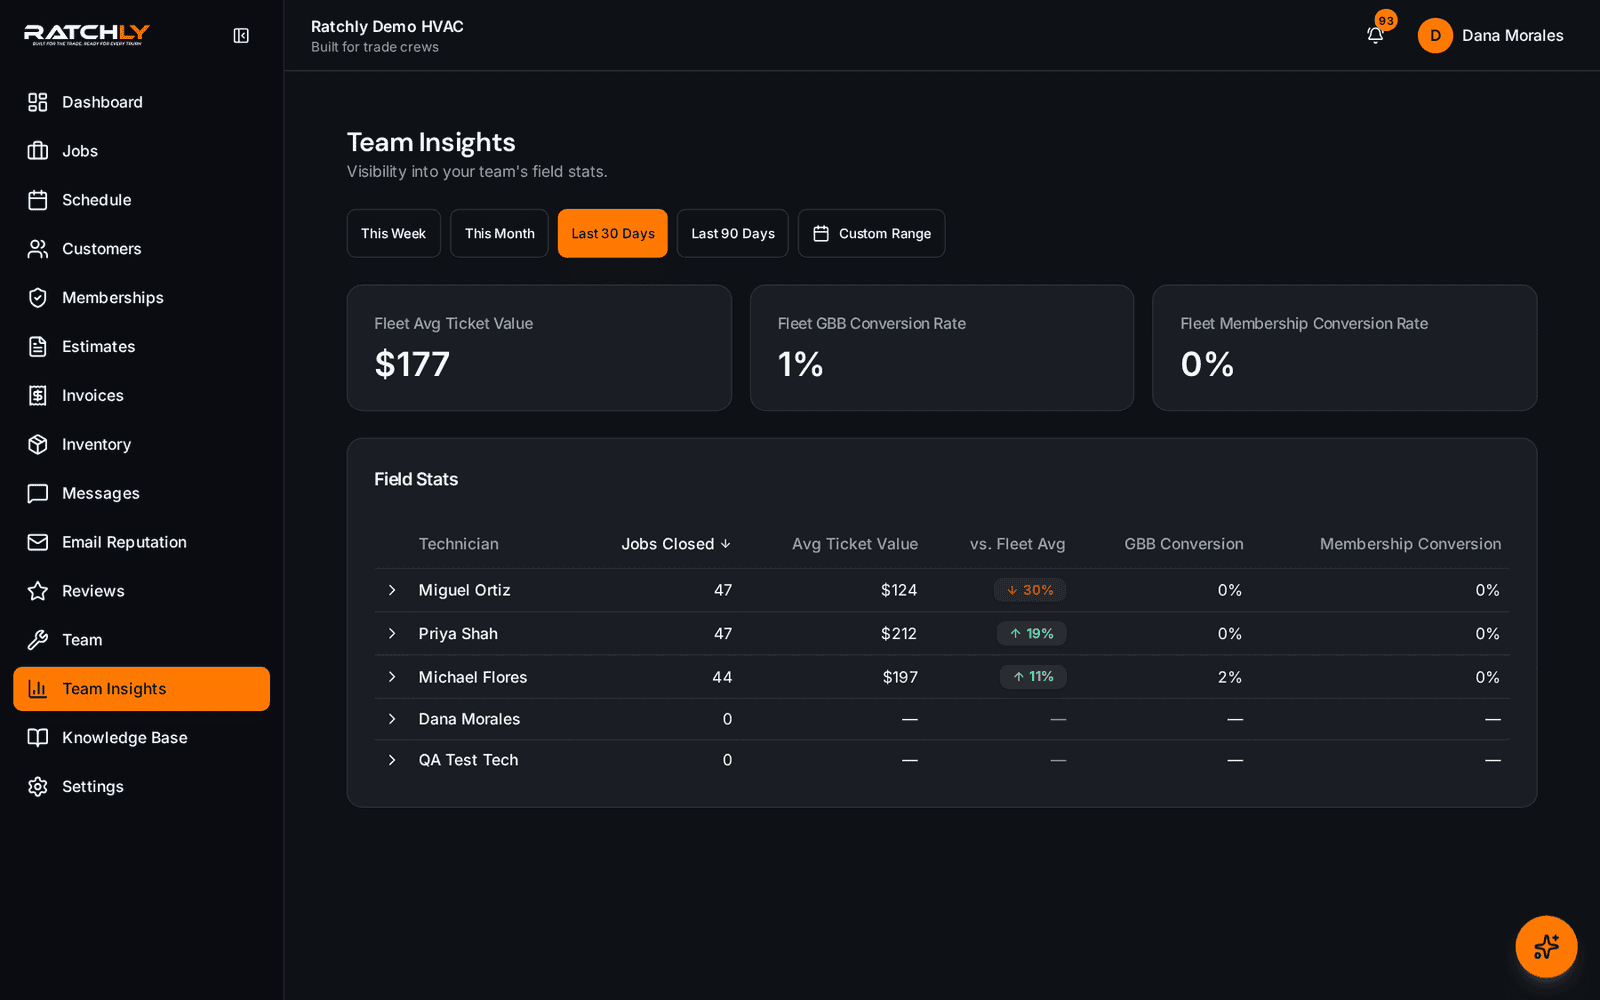
Team-level revenue
Revenue per tech, per period, with drill-down.
What it means for your shop.
- Grow the profitable service lines and cut the rest
- Focus retention efforts on the top 20% of customers
- Own your growth story with fresh, live numbers
Revenue Analytics — quick answers.
Can I compare periods?
Yes. Every chart supports year-over-year and month-over-month comparison.
Do I need to import anything?
No. Analytics run over the live job + invoice data — nothing to import.
Related features
Reports
Revenue by service line, jobs by tech, AR aging, customer lifetime value — no spreadsheets required.
Learn about ReportsBusiness InsightsDashboard
Money at risk, techs on the road, jobs today, month revenue — everything you need at 7am, before the first call.
Learn about DashboardBusiness InsightsTechnician Performance
Ratchly tracks jobs completed, revenue produced, average ticket, and utilization per tech — with fair, live numbers.
Learn about Technician Performance