You can't grow what you don't measure.
Most owners run their business on gut feel because pulling real reports out of QuickBooks + a scheduling app takes a full weekend.
- No idea which service line is actually profitable
- AR aging only visible at month-end
- Tech performance rated on vibes, not numbers
Every report a small HVAC shop needs, one click away.
Ratchly reports run over your live data with no setup — filter by date, tech, service line, or customer segment. Export any of them to CSV.
Live over your live data
No nightly batches, no stale dashboards.
Filter any dimension
Date range, tech, service line, customer tier, membership status.
CSV export everywhere
Every report exports to CSV — feed to QuickBooks, Excel, or your accountant.
Owner + dispatcher views
Role-scoped so techs only see their own numbers.
See it in the real product.
Every screenshot below is a live capture from a Ratchly account — not a mockup.
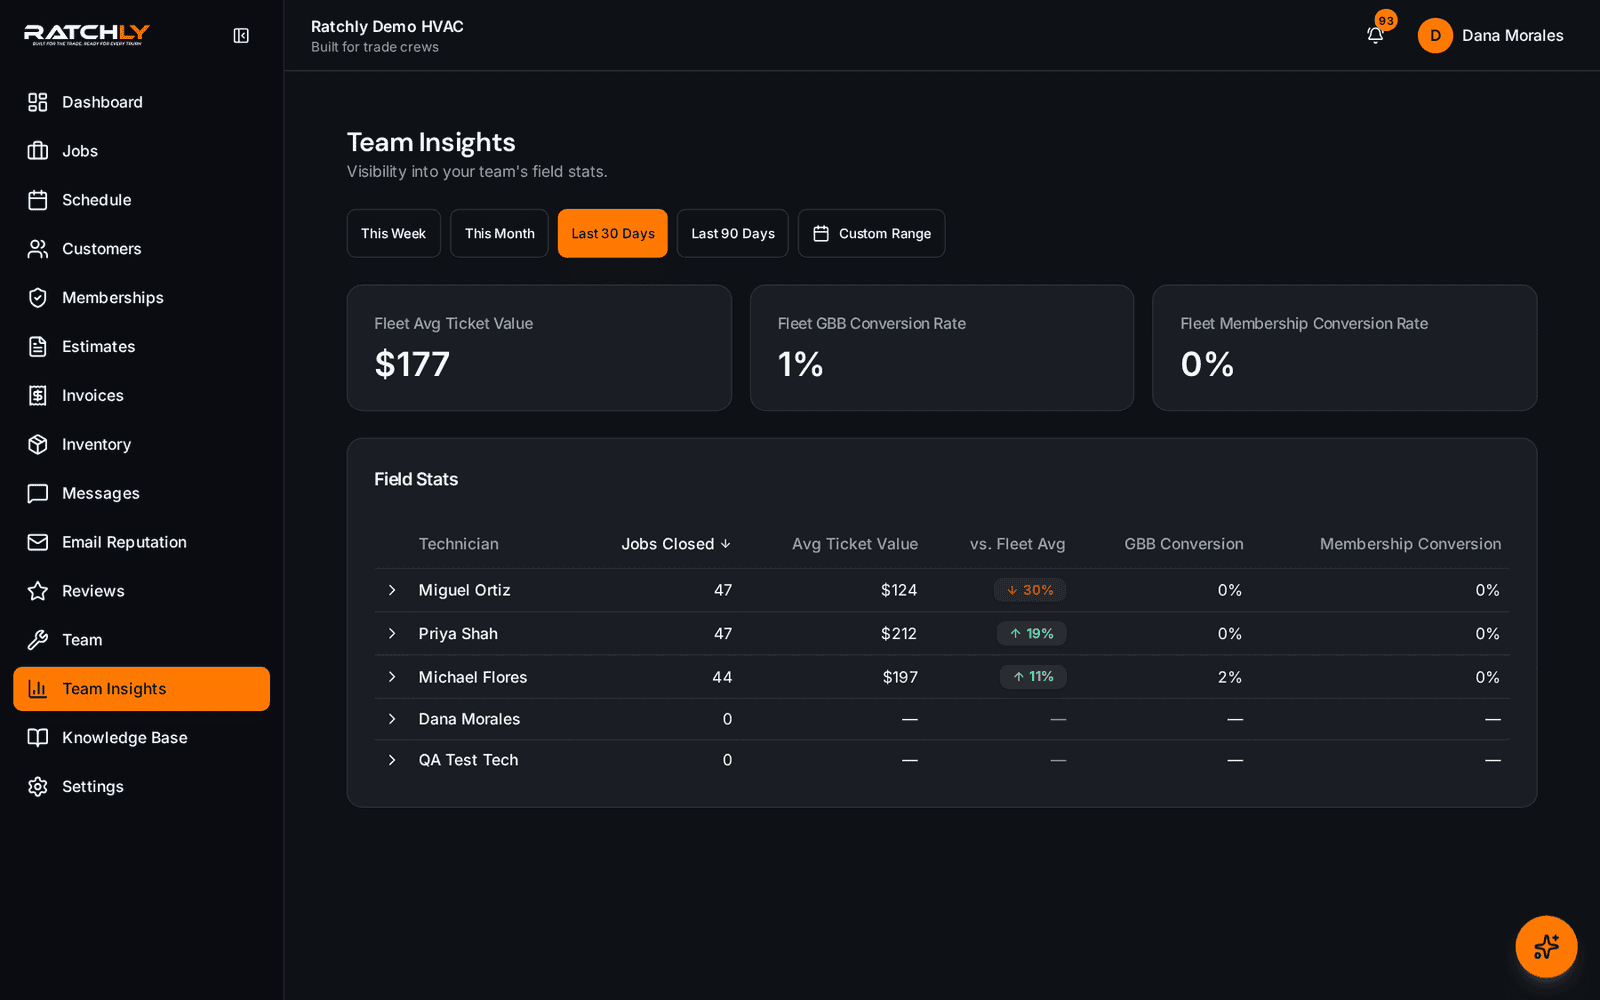
Team insights
Revenue, jobs completed, average ticket, and utilization per tech.
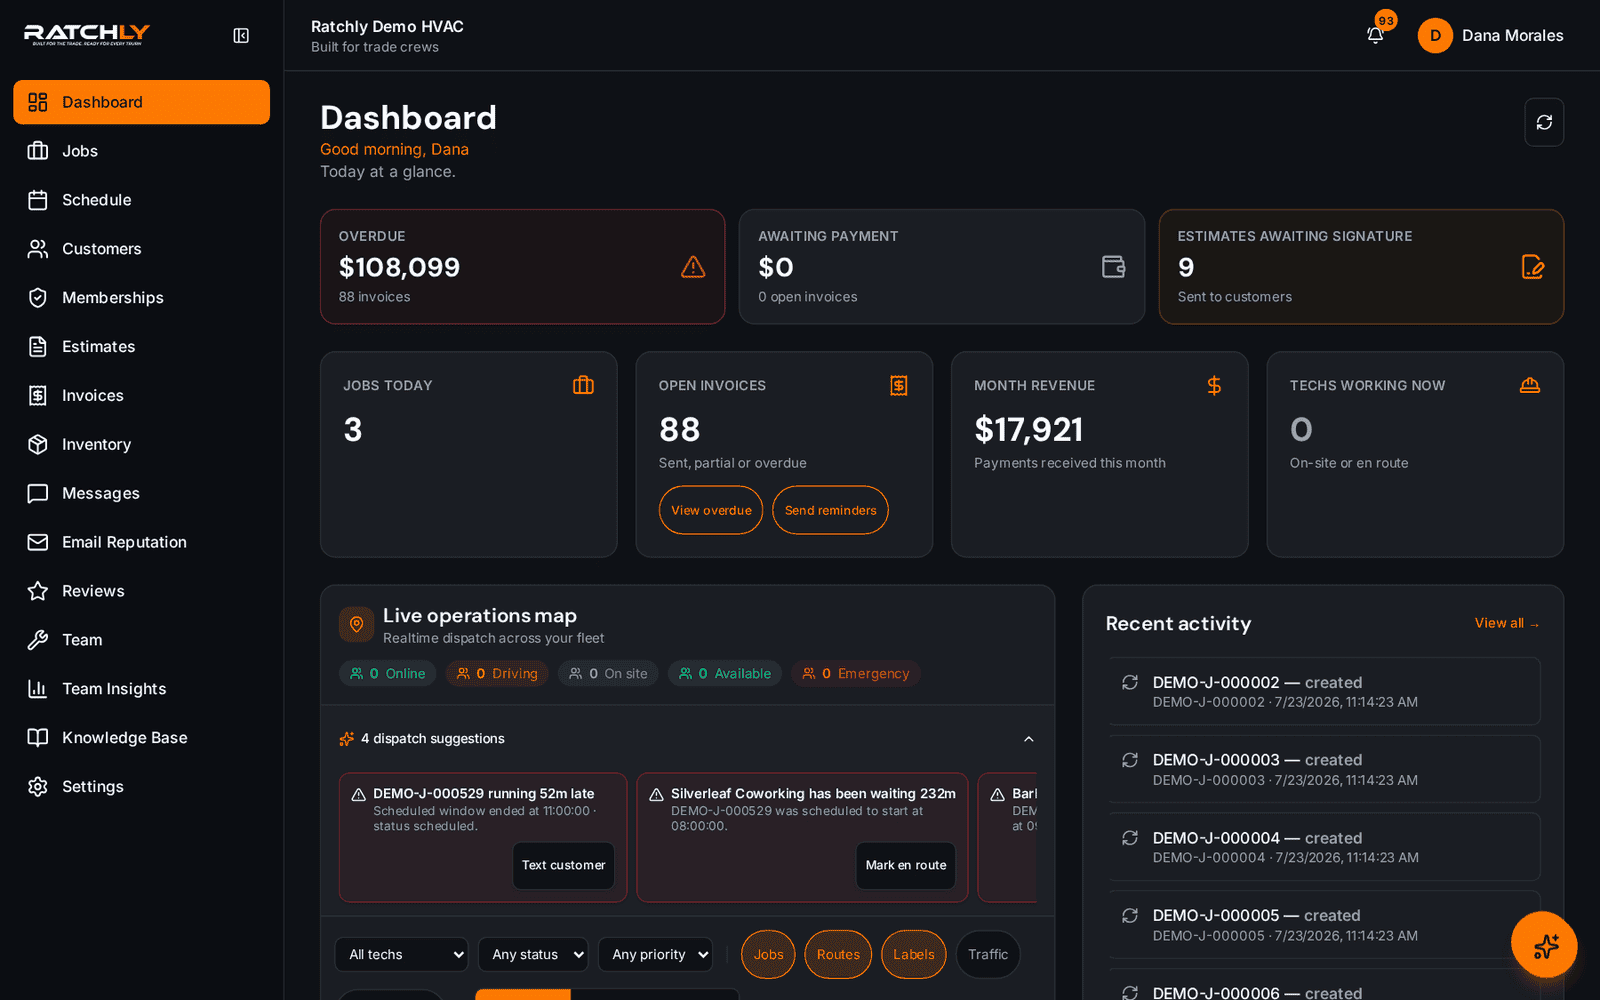
Dashboard KPIs
Top-line revenue and AR aging live right on the dashboard.
What it means for your shop.
- Spot unprofitable service lines before they eat the quarter
- Reward top techs with real numbers
- Give your accountant clean CSVs, not screenshots
Reports — quick answers.
Can I schedule a report by email?
Yes. Any report can be scheduled weekly or monthly to any inbox.
Can I white-label reports for customers?
Yes. PDF exports carry your logo and branding.
Related features
Dashboard
Money at risk, techs on the road, jobs today, month revenue — everything you need at 7am, before the first call.
Learn about DashboardBusiness InsightsTechnician Performance
Ratchly tracks jobs completed, revenue produced, average ticket, and utilization per tech — with fair, live numbers.
Learn about Technician PerformanceBusiness InsightsRevenue Analytics
Ratchly slices revenue by service line, tech, customer segment, and time period so you can double down on what works.
Learn about Revenue Analytics